Mapping
Page for Mapping.
Setting Mapping Defaults
Ad Manager allows you to set your mapping defaults to allow users the ability to customize their mapping environment.
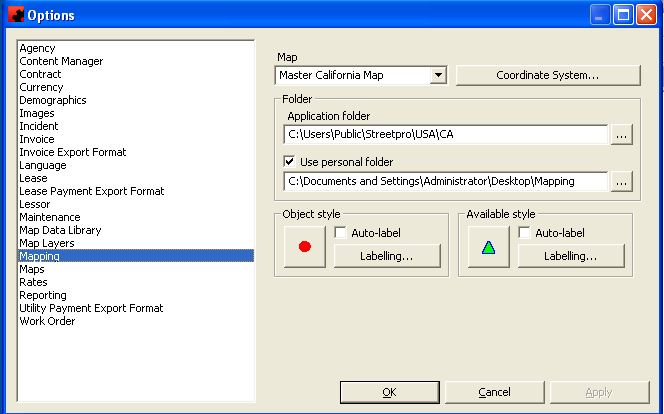
To set mapping defaults, go to the Tools-Options menu item from the main Ad Manager Explorer window. From here, click on the Mapping Page to set your default information for mapping.
Once you have set up your mapping, you can specify the default Map you wish to use, along with the desired Coordinate System. To select the default map to use, click on the Map dropdown list and select the predefined map to use. To select a Coordinate System, click on the Coordinate System button. Traditionally, the Latitude/Longitude coordinate system is most commonly used.
Ad Manager also allows you to identify the location of the files that are used to create the maps. There are 2 different folders where maps can be retrieved from, the Application folder and the Personal Folder. The Application folder is the location on the network where the mapping data is stored. If you are going to be using your machine when not connected to the network, then you can use the Personal Folder option to identify the location of maps on your computer. By default, Ad Manager will use maps stored in the application folder; this can be set by clicking on the ellipsis () and finding the appropriate folder. If you wish to use maps from a local source, click the Use personal folder check box and identify the location of the maps by clicking on the ellipsis (
) and finding the appropriate folder.
Ad Manager has default symbols to be used to represent different items. Any time you are mapping a Site, Face or Faces scheduled to a Contract or Subcontract, the symbol seen in the Object Style box will be used. Any time Ad Manager needs to show available Faces on a map, the symbol seen in the Available style box will be used. If you wish to change either of these symbols, click on the appropriate symbol. Ad Manager will display a window where a different symbol can be selected based on its Font Type, Size, Color, Background and Effects. Once you have the desired font (as seen in the Sample area of the Symbol Style window) click OK.
The Auto-Label feature allows you to have items labelled every time they are mapped. Click on the Auto-Label check box of the appropriate item (Object Style or Available Style) to activate this feature. If you want to change the font used to label items, this can be done by clicking on the appropriate button marked "Abc". Ad Manager will display a window where a different symbol can be selected based on its Font Type, size, Color, Background and Effects. Once you have the desired font type (as seen in the Sample area of the Text) Style window, click OK.
Default position allows you to identify the desired Latitude, Longitude and Zoom Level to use on the Site Map Page.
Adding a Client to the Library
Ad Manager allows users to create and maintain a library of client locations. This library can then be used as a resource to map client locations when mapping Contracts, Subcontracts, Sites and Faces, providing the user and the client with a better picture of where the client locations are with respect to the displayed inventory.
Before you add your first client to the library, you must set the default path to the directory where the client library information will be stored. Go to TOOLS-OPTIONS, and select the Map Data Library Page. On this tab you can click on the ellipsis () next to the Path field to identify the path where all client library files will be stored. All client library files must be stored in this directory, or in a directory below it to be found by Ad Manager.
Adding a New Client Library
To add a client to the library, go to TOOLS-OPTIONS, and select the Map Data Library Page. On this page you can click on the New button () in the Entries box to add a new client library. Ad Manager will display a window allowing you to enter the Client Name field. To select the specific file for this client, click on the ellipsis (
). Ad Manager will ask you to select the appropriate file (once you have selected it, click Open). You can also specify the symbol style to use by clicking on the red circle. From here you can select the font set to choose from, the desired symbol and the color to use. Finally you can select the position, size and font for any labelling of these client locations. If you wish to have any associated location information automatically appear on the map, select Auto Label. If you wish to have labels appearing, even if they may overlap with each other, select Overlap. Once you have finished customizing information for this client, click OK.
Modifying a Client Library Entry
To change information for a specific Client Library entry, highlight the client Library in the Entries box of the Map Data Library Page. After you have highlighted the record you wish to change, double click it or click on the Properties button () in the Entries box. Ad Manager will allow you to change any of the properties that have previously been set (Description, file to use, Symbol and Labelling properties).
Deleting a Client Library Entry
If you wish to delete a Client Library entry, highlight the client Library in the Entries box of the Map Data Library Page. After you have highlighted the record you wish to delete, click the Delete button ().
Charting from the Map
Once you have a Subcontract on a map, available Faces with the same characteristics can be shown on the same map, allowing you to chart the Subcontract by assigning and removing Faces directly on the map.
Note: Each Available Location layer is created using the date range of a specific Subcontract (or flight), and is therefore mapped in a close relationship with that Subcontract (or flight). You can only assign a Face to a Subcontract if it is one of a pool of available Faces that have been mapped to that Subcontract.
To add a Subcontract to the map, see Mapping a Subcontract.
To add available locations to the map, select Tools - Show Available Faces...
By default the entire Subcontract is displayed. If you have more than one flight for this Subcontract, you can choose it from the drop down list.
Once you have added the available Faces layer, you will see a map similar to the following:
Note that the ![]() button and the
button and the button on the button bar have been enabled. These are used to allocate or de-allocate Faces to the Subcontract.
To chart a Face to the Subcontract, click on the ![]() button then click on the Face symbol on the map that you wish to assign. Ad Manager will perform the usual verification checks (scheduling and line-of-sight conflicts) before assigning the Face to the Subcontract. Once the new Face has been assigned, its symbol on the map will now be the same as the rest of the Faces assigned to that Subcontract.
button then click on the Face symbol on the map that you wish to assign. Ad Manager will perform the usual verification checks (scheduling and line-of-sight conflicts) before assigning the Face to the Subcontract. Once the new Face has been assigned, its symbol on the map will now be the same as the rest of the Faces assigned to that Subcontract.
To release a Face from the Subcontract, click on the button then click on the Face symbol on the map that you wish to unassign. Once the Face has been released from the Subcontract, its symbol on the map will become the same as the rest of the available Faces.
Demographic Shading on a Map
Type topic text here.
Drag and Drop Mapping
Ad Manager allows you to map saved filters of Faces, Subcontracts and Contracts by dragging and dropping them on a map. To accomplish this, you must first have a saved filter from which to acquire desired data for mapping.
For information on how to create a filter, see How to Filter.
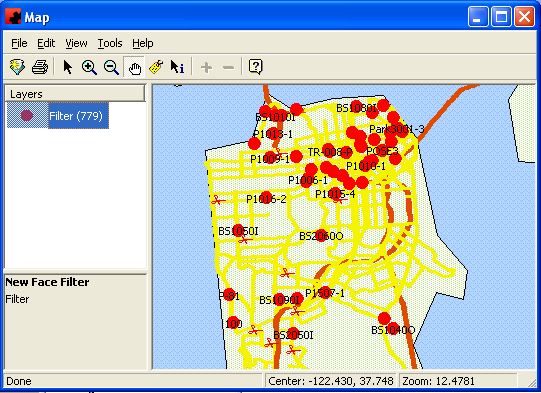
Next, open the Map Tool by clicking on the button or go to the Tools menu and select Map. The window containing the list of Faces, subcontracts or contracts to be mapped must be side-to-side with the Map Tool so that you can see both windows.
Drag and Drop Faces
Drag and Drop Contracts
Drag and Drop Subcontracts
Drag and Drop Faces on a Map
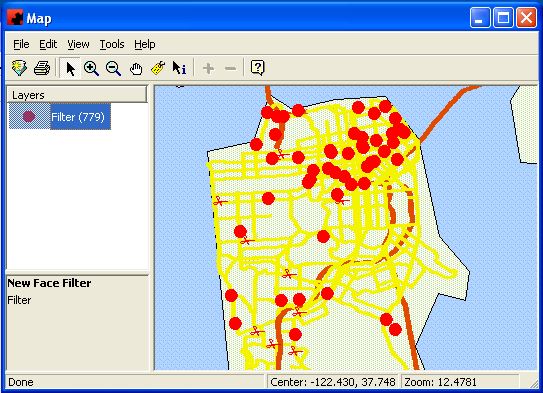
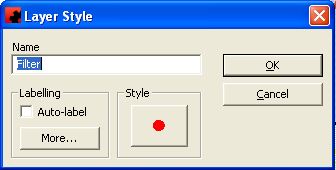
Left-click the filter of Faces you wish to map and drag to the map in the Map Tool window and release. The Layer Style dialog box will appear, asking how you want to display the Faces you have mapped. Please note that you cannot select some of the Faces in your filter to drag and drop on a map, only the entire filter can be dragged and dropped.
The Name field enables you to create a name for the map layer that is different from the FILTER name (This is the default). You may also specify the symbol and label style for this map layer. These styles can also be changed later, but the name of the map layer cannot.
Once you have made the necessary selections on the Layer Style dialog box, select the button, and your Faces will be mapped.
Drag and Drop Contracts on a Map
Open the desired filter of Contracts. Holding down either the SHIFT or CTRL key, select the Contracts you wish to map. Left-click on your selection, drag it to the map in the Map Tool window and release.
The Layer Style dialog box will appear, asking how you want to display the Contract you have mapped. If you selected more than one Contract to map, a separate Layer Style dialog box will appear for each Contract.
The Name field enables you to create a name for the map layer that is different from the CONTRACT NUMBER (This is the default). You may also specify the symbol and label style for this map layer. These styles can also be changed later, but the name of the map layer cannot.
Once you have made the necessary selections on the Layer Style dialog box, select the button, and your Contract(s) will be mapped.
Drag and Drop Subcontracts on a Map
Open the desired filter of Subcontracts. Holding down either the SHIFT or CTRL key, select the Subcontracts you wish to map. Left-click on your selection, drag it to the map in the Map Tool window and release.
The Layer Style dialog box will appear, asking how you want to display the Subcontract you have mapped. If you selected more than one Subcontract to map, a separate Layer Style dialog box will appear for each Subcontract.
The Name field enables you to create a name for the map layer that is different from the BRAND name (This is the default). You may also specify the symbol and label style for this map layer. These styles can also be changed later, but the name of the map layer cannot.
Once you have made the necessary selections on the Layer Style dialog box, select the button, and your Subcontract(s) will be mapped.
Geocoding Sites
Before you can use the Mapping Tool you must have your locations geocoded. Geocoding is the assignment of latitude and longitude to each Site in the database, in order that a symbol representing that Site will appear in the correct geographical location. The following describes one method of geocoding Sites that requires no more than a good knowledge of the geographical area, where the inventory is located, and basic map-handling skills.
If you are geocoding an entire plant, or section of a plant, it may be useful to work off a list of Sites in the Explorer window, beginning with the top-most one. Using the Arrow tools, you can work your way down that list without having to open and close many Site dialog boxes in succession.
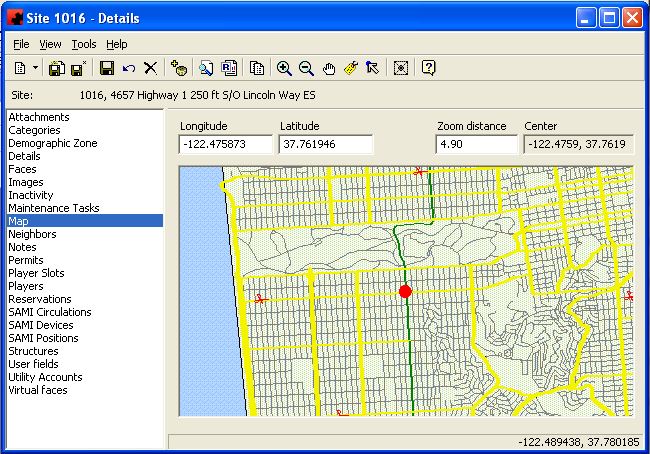
Open the dialog box for the first Site that you want to geocode and bring the Map Page into focus. Use your Zoom in and Zoom out
buttons as well as your Pan tool
to find the approximate area where the Site is located. Click on the Set latitude/longitude tool
to engage it, then click on the map at the precise location of the Site. This will place the symbol at the correct location and also "read" the Site's latitude and longitude off an invisible layer on the map, writing it directly into the Site in Ad Manager. If your symbol is not exactly right where it should be, simply repeat this step until you are satisfied that you have correctly positioned the Site on the map. To preserve the Site's latitude and longitude in the database so that this Site will always appear in the correct spot, simply save the Site in the usual manner.
For information on how to maneuver around the map, click here. For information on saving a Site, click here.
TIP: Once the first Site is saved you can record its latitude and longitude and enter these into the corresponding fields for the next Site on the list. By default the zoom distance will come up the same every time you open a Site. By entering the previous Site's location, you will approximate the position of the next Site, which will only require fine-tuning using the Set latitude/longitude tool.
You can also use the Center the Map on this Site tool to help you position the Site on the map. Clicking on this button will position the map so that the Site appears in the middle of the view pane.
For more information on the Site Map Page, click here.
Label Items on the Map
Whether you are on the Site Map Page or in the Map Tool, you have the option of Labelling items on your map as needed. Labels can be created for regions, features, streets, symbols, or entire Layers.
Adding Labels on the Map
To add a Label to your map, click on the Label Map Feature button () or go to Tools - Current Map Tool - Label, then click on the item on the map you wish to Label.
Labelling Symbols on the Map
To Label the symbols for your Subcontract, Faces, etc. in the Map Tool, double-click on the Layer on the left side of the window and select the Auto-label check box, so that there is a check mark in it. You can select the Font, size, position and zoom range by clicking "More". Once you have made the appropriate changes, click OK.
Labelling Entire Layers on the Map
To Label an entire Layer on your map, go to Tools - Options on the Main Ad Manager Window. Go the the Map Layers Tab, and double-click on the Layer you wish to Label in the Layer types box. When the Layer Type - Details screen opens, click on the Auto-label check box. You can select the Font, size, position and zoom range by clicking "More". Once you have made the appropriate changes, click OK.
Clearing Labels from the Map
To clear the Labels from your map, go to Tools - Clear labels. This feature clears all Labels that you placed on your map using the Label Map Feature Tool.
Clearing Labels for Symbols on the Map
To clear the Labels for your symbols for your Subcontract, Faces, etc. in the Map Tool, double-click on the Layer on the left side of the window and de-select the Auto-label check box, so that it is now blank. Then click OK.
Clearing Labels for an Entire Layer on the Map
To clear the Labels for an entire Layer on your map, go to Tools - Options on the Main Ad Manager Window. Go the the Map Layers Tab, and double-click on the desired Layer in the Layer types box. When the Layer Type - Details screen opens, click on the Auto-label check box so that it is now blank. Then hit OK.
Mapping Clients Locations
Type topic text here.
MapTool Edit Menu
The items found under the Edit menu are used to modify the display of information viewed on the map.
The Style option on this menu enables you to modify the display attributes of a selected layer. For example, you may have created a display layer using a red circle, font size 10 to identify the Faces assigned to a Subcontract, and want to change this symbol to a blue square, font size 12. Similarly, you may want to specify the default style for auto-labels on a map layer, or control auto-labeling by turning it off temporarily while you work with the map.
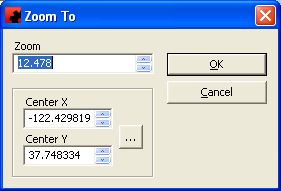
The Zoom to option enables you to bring a particular area of the map into view by snapping to a particular latitude and longitude or by setting a specific zoom distance.
The Zoom to Layer option enables you to show the entire mapped layer that is highlighted in the map pane.
The Refresh option enables you to update your map with any data that may have changed elsewhere in Ad Manager.
MapTool File Menu
The items found under the File menu are used to add data to the map in the form of display layers.
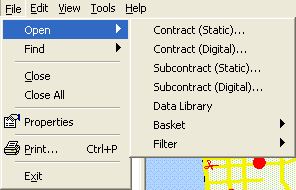
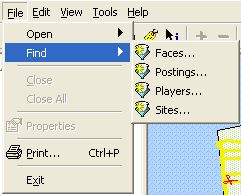
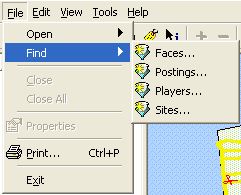
File - Open enables you to select a Contract, Subcontract, previously saved Site filter, previously saved Site basket, previously saved Face filter, previously saved Face basket, previously saved Posting filter or Posting basket, or a file in your Data Library and display its contents on the map. You can add as many of these layers as you want and any combination of these layers.
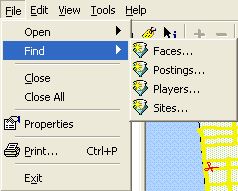
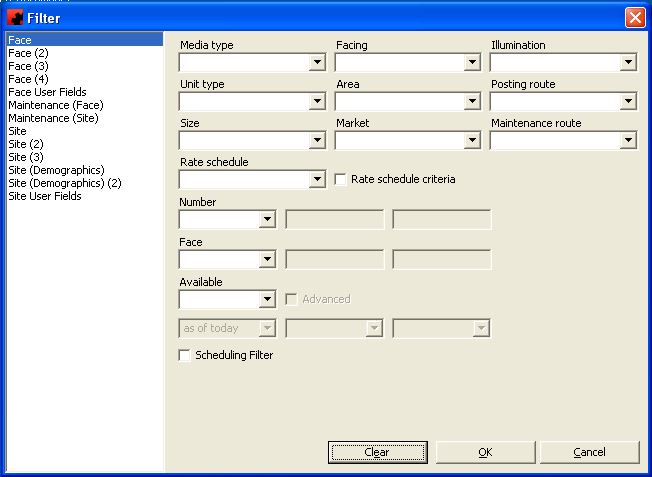
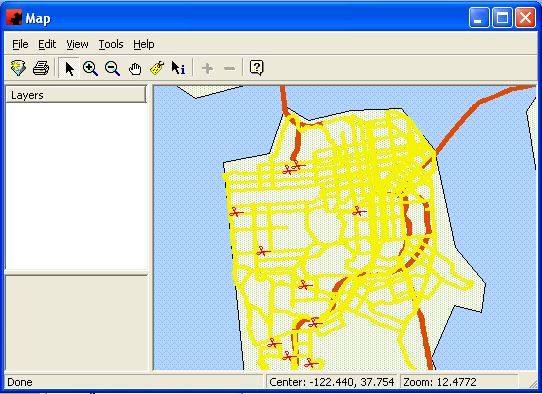
Alternatively, you can use the Find - Sites, Find - Faces or the Find - Postings options to search for Sites, Faces or Postings that you have not previously saved as a filter. For example, you may wish to see all the Faces in a certain area, or all Faces that face north, or all the Postings for a certain advertiser or time period. You may save this filter for future use.
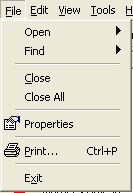
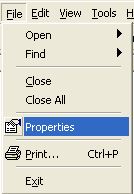
File - Close and File - Close All are used to remove the highlighted layer or all data layers from the map as appropriate.
File - Properties will display the details of the layer you have highlighted. If you have highlighted a Contract or Subcontract it will open the Contract or Subcontract. If you have a Face filter mapped you will get a popup prompting you to change the style of the layer. If you have used Find - Faces to display a selection of Faces, the filter screen will be displayed, enabling you to modify the criteria used in the selection of Faces.
File - Print will send a simple copy of the contents of the map pane to the printer.
File - Exit will close the Map Tool.
MapTool Tools Menu
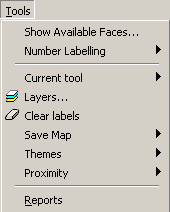
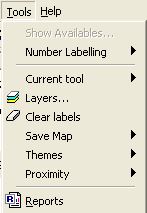
The contents of the Tools menu item vary depending on the contents of the map layer selected at the time. The following menu options will be available if you are on a Subcontract layer:
Otherwise, the following menu will be displayed:
Show Available Faces enables you to map the available Faces for the Subcontract layer selected. For instance, if you have previously displayed a Subcontract on the map, this option will automatically search the database for available locations that correspond to the particulars of that Subcontract, such as media type, date range and market. It is possible to display multiple Subcontracts simultaneously, together with available Faces for each. You cannot, however, assign a Face from one available layer to a different Subcontract.
The Number Labelling option allows you to number your Subcontract Face symbols using sequential numbers ( 1, 2, 3,...). For more information on how to number Faces sequentially, click here.
Current tool allows you to select a tool for use. The current tools menu choices are: the Select Tool, the Zoom In tool, the Zoom Out tool, the Pan tool, the Label tool, the Details tool and if you have a Subcontract layer currently highlighted, the Accept and Release tools. For more information on these tools, see Map Tool Buttons.
Layers shows you what layers are mapped at the current zoom level and allows you to move them up or down in the map order by using the and
buttons to move the highlighted layer.
Clear labels will remove any labels currently displayed that were placed on the map using the Label tool. Note: This will not delete the layers themselves, or the labels from the mapping data. Only the display will be affected.
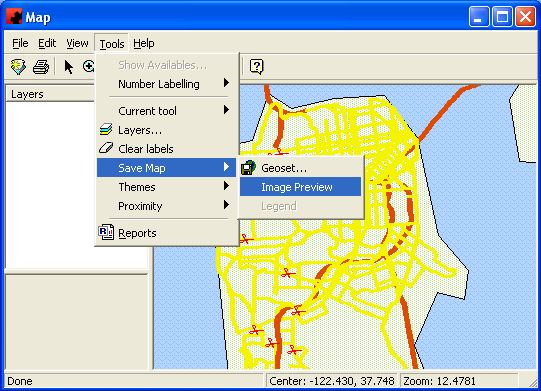
Save map will allow you to save a map either as a geoset that may be opened using MapInfo or as an image that may be inserted in a report or other document.
Themes allows you to save the current map custom settings as a theme to be applied at a later date.
The Proximity tool allows you to draw a circle around a selected item or around all items on a selected layer. This is a very useful means of locating available Faces that lie within, or perhaps outside, a certain distance from the selected points on the map (such as the client's commercial locations). You can create and display multiple proximities on the map simultaneously. For more information on using the Proximity tool, click here.
Reports opens the Reports menu giving you access to run a report. For more information on reports, click here.
MapTool View Menu
The items found under the View menu are used to manage the way you see your maps.
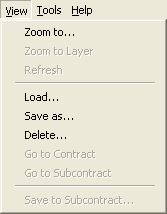
The menu items available change depending on the contents of the layer currently selected. For instance, if the selected layer were a Subcontract, the following options would be available.
If the selected layer is not a Subcontract, the following options would be available.
The Load, Save as and Delete items on this menu are used to display a saved map view, to save a display as a map view, or to delete a saved map view respectively. A saved map view, such as "Milwaukee Downtown", is a particular display which for some reason you want to save for further use at another occasion. For example, if you have a map consisting of the entire market, you may want to save views of each borough, individually so that if you need to create a map of "Milwaukee Downtown", for instance, you can just load that view. Creating a single map of the market and then saving views is helpful if you sell your products over a wide area because it allows you to map your Sites, Faces, Postings, Contracts or Subcontracts once and then use your saved views to print them.
When the map display is of Faces assigned to a Subcontract the Save to Subcontract option enables you to save the map view directly to the Subcontract itself. This will make the view available when you are on the Map Views tab of the Subcontract. It is particularly useful if you have a very complicated map that you do not want to re-create over again and you know you will use it repeatedly. You can see a list of all such saved views when you are on the Subcontract Map Views tab; by double-clicking on a view you will launch the Map Tool window with the view. For more information on saved views, click here.
Move Around the Map
Whether you are using the Map Tool or the Site Map page, there are four ways to move around the map in Ad Manager.
Pre-Defined Zoom Layers
Pan Tool
Zoom In and Zoom Out Tools
Zoom To Tool
The Pre-Defined Zoom Layers
A pre-defined zoom layer is a saved map view, such as "Milwaukee Downtown", a particular display which for some reason you want to save for further use in another occasion.
To save a view as a pre-defined view, create the map and zoom into the area you wish to save as a view. Go to the View menu and select Save as... The View Save dialog box will appear, prompting you to name the new view. Give your new view a name and click on the button.
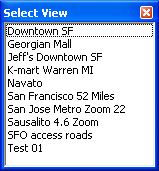
To access these saved map views, you must go to the View menu in the Map Tool and select Load...
The Select View dialog box will open allowing you to choose the saved view you wish to display.
To delete a pre-defined view, go to the View Menu and select Delete... The Delete View dialog box will appear. Highlight the view you wish to delete from your list and click on the Delete button.
The Pan Tool
The Pan tool allows you to move the map to see different areas not visible on the screen. Click on the button or go to the Tools menu and select Current tool and then pick Pan.
To use the Pan tool, put your mouse over the map, hold down the left mouse button and drag the mouse. The map will move with the Pan tool; when you release the mouse button, Ad Manager will draw the new area of the map.
The Zoom In and Zoom Out Tools
When using the Zoom Tools, Ad Manager will redraw the map using only layers that meet the zoom layering criteria. These criteria are set when the map layers are first added to the map.
The Zoom In Tool enables you to increase the magnification level at which you are viewing the map. To use it, click on the button or go to the Tools menu, select Current tool and pick Zoom in.
By placing the Zoom In tool over the map, you can click to see the map zoomed in twice as close as before, centered where you clicked. If you hold your left mouse button down and drag the mouse, you will see a box being drawn on the map. When you release the left mouse button, Ad Manager will zoom into the specified area. The zoom level you are set to is shown in the bottom left corner of the window, and is shown in miles.
The Zoom Out Tool enables you to decrease the magnification level at which you are viewing the map. To use it, click on the button or go to the Tools menu, select Current tool and pick Zoom out.
By placing the Zoom Out tool over the map, you can click to see the map zoomed out twice as much as before, centered where you clicked. If you hold your left mouse button down and drag the mouse, you will see a box being drawn on the map. When you release the left mouse button, Ad Manager will shrink the map to the size specified by the box. The zoom level you are set to is in the bottom left corner of the window.
The Zoom To Tool
The Zoom to Tool enables you to bring a particular area of the map into view by snapping to a particular latitude and longitude or by setting a specific zoom distance. To use this tool, go to the Edit Menu and select Zoom to...
The Zoom To dialog box will appear giving you the option to select a Zoom distance (in miles), or a latitude and longitude to zoom to.
Click on the button when you have typed in the zoom to information and your map will then display the zoom specifications you selected.
Fields
Latitude - The latitude (Center Y) is how many degrees north (positive value) or south (negative value) of the equator the Site is.
Longitude - The longitude (Center X) is how many degrees east (negative value) or west (positive value) of the Prime Meridian the Site is.
Zoom - The zoom is the distance (in miles) across the width of the map.
Numbering Faces on a Map
There are two ways to number Faces on a mapped Contract, Subcontract or Face filter. You can number the Faces with their Face Numbers, or you can number the Faces Sequentially (1, 2, 3...etc.).
Numbering Faces with their Face Numbers
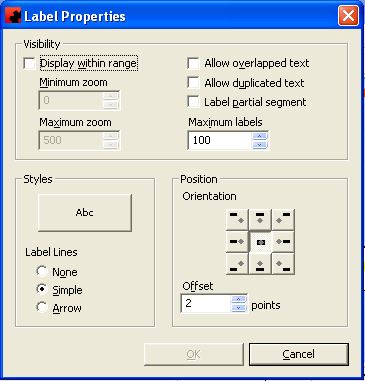
Once you have mapped your Faces, Subcontracts, or Contracts, double-click on the layer you wish to number. The Layer Style dialog box will appear. Click on the Auto-label check box and click on the More... button, if you wish to specify your Label Style. The Label Properties dialog box will open.
In the Visibility section, you can choose to display the labels within a range that you specify, you can allow overlapping text (for Faces that are really close together), you can allow duplicated text, label partial segments or you can specify a maximum number of labels that you want on your map.
In the Styles section, you can choose the font and color of your labels by clicking on the button as well as the style of your label line.
In the Position section, you can specify where in regards to the Face symbol, you wish to place the label and how far you wish to offset the label from the center of the symbol.
Once you are done selecting your options, click OK and then OK again on the Layer Style dialog box. Your symbols will now be labelled with their corresponding Face numbers. If sequencial numbers appear in place of the actual face numbers, click on Tools - Number Labelling - Show.
Numbering Faces Sequentially
Once you have Auto-labeled your symbols following the above directions, go to Tools - Number Labelling - Show. This will number the Faces sequentially.
To specify an order for your numbering sequence, go to Tools - Number Labelling - Order. The Order dialog box will open. Select your order as you would in any other List View in Ad Manager and click OK. Please note that you should set up your order here to match the order of Faces on your location list.
For detailed information on Ordering your Faces, see How to Sort on a Column.
To remove sequential numbering from your map, go to Tools - Number Labelling - Show. This will return the labelling back to using Face numbers.
To remove all labelling from your faces, double-click on your layer and click in the Auto-Label check box so that it blanks out, then hit OK.
For detailed information on Mapping Contracts and Subcontracts, see Map Contracts or Subcontracts. For more information on mapping Faces, see Map a Site or Face.
Printing a Map
There are three recommended ways to print a map created in Ad Manager, using a Map Report Layout in Ad Manager, using a Word Template or using MapInfo. The Map Report Layout in Ad Manager should only be used if you are mapping a Subcontract.
First you should create your map.
Once you have spotted your map, and are ready to print it using Ad Manager Reports or a Word Template, go to Tools - Save Map - Image Preview.
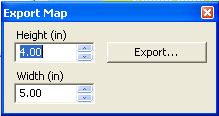
The following Export dialog box will appear.
Specify the size of the map you wish to export. For a portrait map (81/2" x 11"), choose 13 inches for the Height and 10 inches for the Width. For a landscape map, choose 10 inches for the Height and 13 inches for the Width. Then click on the Export button. The Save As window opens.
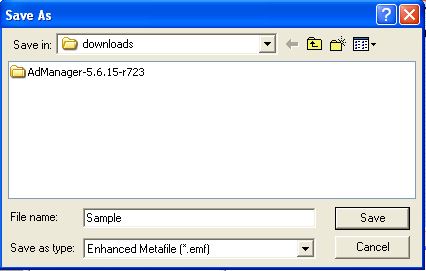
Select where you wish to save the map image and name the file. Leave it as file type Enhanced Metafile (*.emf) and click on the Save button. Close the Export dialog box.
Next you must save the Legend. Go to Tools - Save Map - Legend.
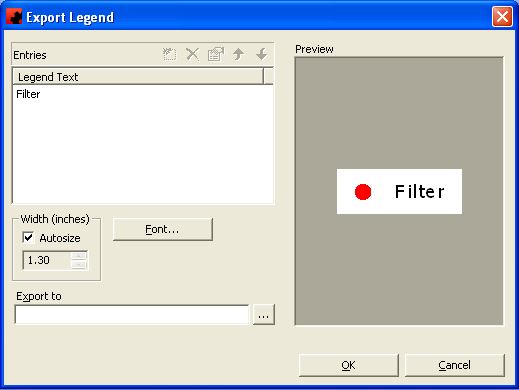
The Export Legend Window will open.
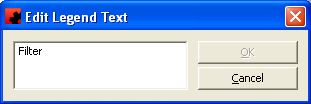
This is where you prepare and save your Legend. To change the font used in the legend, click on the Font button. To change the text used in the legend, click on the Edit button or double-click on the legend text. The Edit Legend Text box appears.
Make the changes you wish to the text and then click on the OK button. You can see a preview of your legend in the right-hand side of the Export Legend Window.
Next, you need to specify where the Legend should be saved. Click on the button under the Preview window. Select the folder where you wish the Legend to be saved and name the Legend file. Leave it as file type Enhanced Metafile (*.emf) and click on the Save button. Now click on the OK button on the Export Legend Window.
Printing A Map Using a Ad Manager Map Report Layout
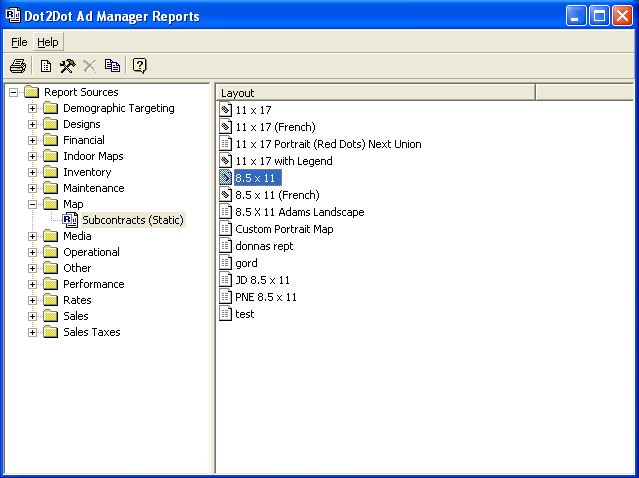
Close your Map Tool and open up the Reports Menu by clicking on the button. Go to Map, then Subcontract and double-click on the Layout you wish to use.
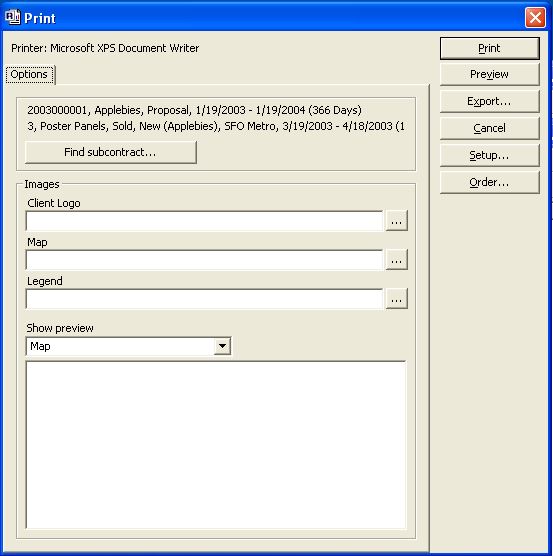
The Print window will open.
Click on the Find Subcontract button to select the subcontract that you have mapped. If you wish to add your client's logo on to the map, click on the button next to Client Logo and specify where this logo can be found. Click on the
button next to Map to specify where your saved map image is. Click on the
button next to Legend to specify where to find your saved legend. Then click the preview button to see your map layout.
From here you can print the map layout by clicking on the print option. If you want to e-mail it, from the Print Window, click the Export button. The "Save As" window opens. Select where you would like to save your map and name it. In the Save As Type field, select Adobe PDF file (*.pdf) and click Save. Now you can attach this pdf file to your e-mail.
Printing A Map Using A Word Template
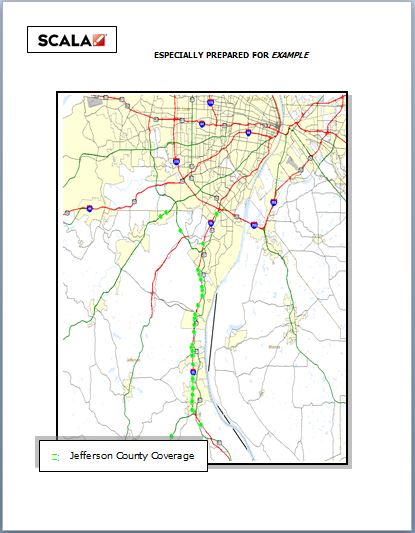
Close your Map Tool and open up your Word Template (if you have a template created for this purpose or contact us for examples). You can insert your map and legend as pictures within specially created Text boxes. See example below.
Highlight the words "Replace This text with your map image". Go to Insert - Picture - From File and select your map image file from wherever you saved it. Then hit Insert. Next, highlight the words "Replace this text with your legend". Go to Insert - Picture - From File and select your legend file from wherever you saved it. Then hit Insert. Finally, edit the title "Especially Created For:" by filling in the Client's name.
Your map is now ready to be Printed or Saved. Once you save it as a Word document, you can e-mail the file as an attachment.
Printing A Map Using MapInfo
Once you have spotted your map, and are ready to export it to print it in MapInfo, go to Tools - Save Map - Geoset.
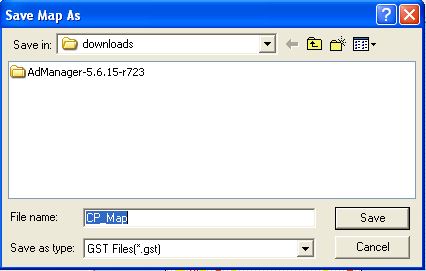
The Save Map As screen will open.
Select where you would like to save your geoset and give the file a name. Save as type should be a GST File (*.gst). Then click on the Save button.
If you have MapInfo version 6.5 or higher, you can use the MapX Geoset Utility to open your geoset file. If you have a version lower than 6.5, you must open an existing MapInfo workspace, and open the individual layers as tables.
For more detailed information about using geosets in MapInfo, contact our product support team.
Using Proximity to Chart
The Proximity Tool enables you to draw buffer zones around certain kinds of mapped data, such as charted locations or points or areas drawn on the basis of information contained in a Data Library file. It is commonly used to place client or advertiser locations on the map and draw an area around those locations in order to see what locations have been charted, or are available, inside or outside that area. This information can then be utilized to chart a more appropriate showing for your client.
Importing a file into the Ad Manager Data Library
A common and highly useful source of map data is a digital phonebook product such as ProCD or InfoUSA which can be used to build a list of client locations (contact us for recommended products). Once this information has been saved in a database (.dbf ) format it can be imported into the Ad Manager Data Library and made available for use in the Map Tool.
To import a data file into the Ad Manager Data Library, see Add a Client to the Library.
Adding a Data Library to the Map
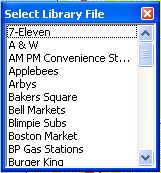
After launching the Map Tool, select File - Open - Data Library. You will see the Select Library File dialog box
listing the data that has been imported into the Ad Manager Data Library. Select the data you wish to display and the contents of the data file will appear as a new layer on your map.
Using Proximity to draw a Buffer Zone around all the data points or areas on a map layer
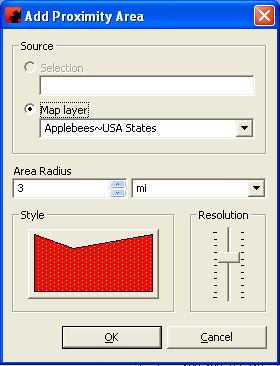
Once you have a map layer open, select Tools - Proximity - Add Area. The following dialog box will be displayed:
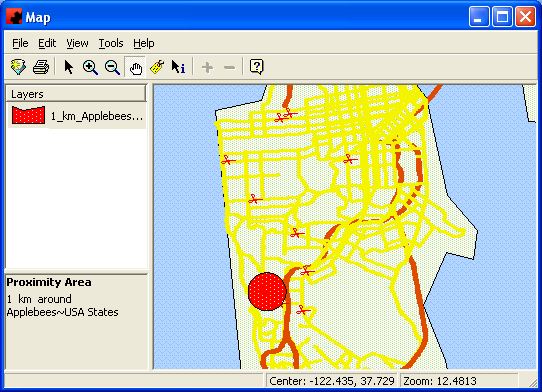
You can draw a "buffer" zone around all the data points or areas contained on a map layer by selecting the desired layer from the list. You can also draw a buffer around a line (or road). Select the layer then specify the radius of the buffer zone and its color and pattern styles. Finally, select a resolution for the buffer - this will determine how smoothly drawn the buffer will be. Note: the higher the resolution, the longer it will take to draw on the screen.
Below is an example of a map with a proximity buffer drawn on it.
Drawing a Proximity Buffer around one or more selected points or areas on a map layer
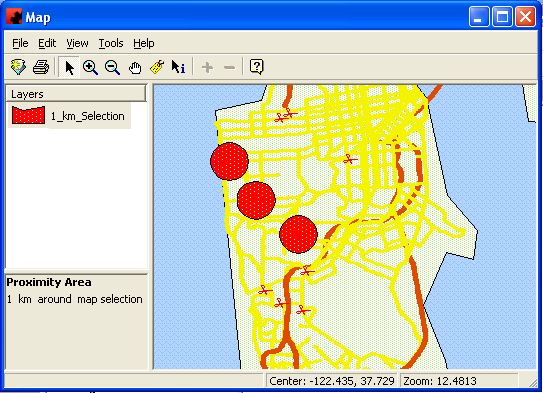
First use the Select tool together with the Control (Ctrl) key on your keyboard to select the points around which you want to draw the buffer zone. Note the points MUST be on the same layer (i.e. client locations cannot be selected along with available faces). Then select Tools - Proximity - Add area.
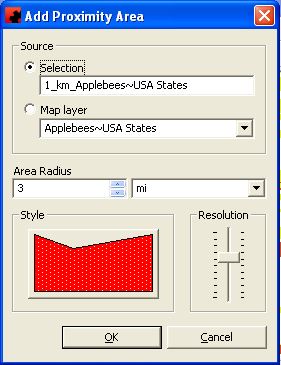
The following dialog box will be displayed:
Set the radio button option to Selection rather than Map Layer. Then proceed as previously described, specifying the radius for the buffer and its color and pattern styles.
Below is an example of a map with a proximity buffer drawn on it.
Using Proximity To Chart
Once you have created a proximity buffer around a map layer or specific selections on a map layer, you need to map the Subcontract that you will chart. To do this, see Mapping a Subcontract.
Next, you will need to map available Faces that fit the criteria of the selected Subcontract. Highlight the Subcontract layer and go to Tools - Show Available Faces.
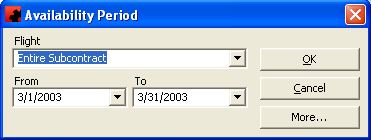
The Availability Period dialog box will appear.
If you do not wish to change any of the criteria for the available locations, click on the OK button. If you wish to change the criteria, click on the More... button and a filter will open.
Once you have chosen the criteria for your availability period, the available locations will appear on your map.
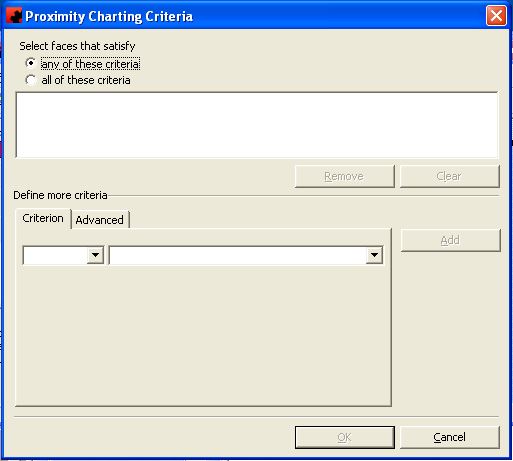
Next, highlight the subcontract layer and go to Tools - Proximity - Chart and the following dialog box will appear.
On this screen, select the criteria for proximity charting. First, select the faces that satisfy either any of these criteria or all of these criteria by clicking on the radio button next to the option you want. Then you must define the proximity criteria. Click on the first pull-down list to choose whether you want faces within or not within the radius. Next, select which radius you wish to chart with. Once your criteria is selected, click on the Add button to select it. You can continue to do this for any other proximity areas you have created. More complex requirements can be generated from the Advanced Tab. Once you have selected your desired criteria, click OK.
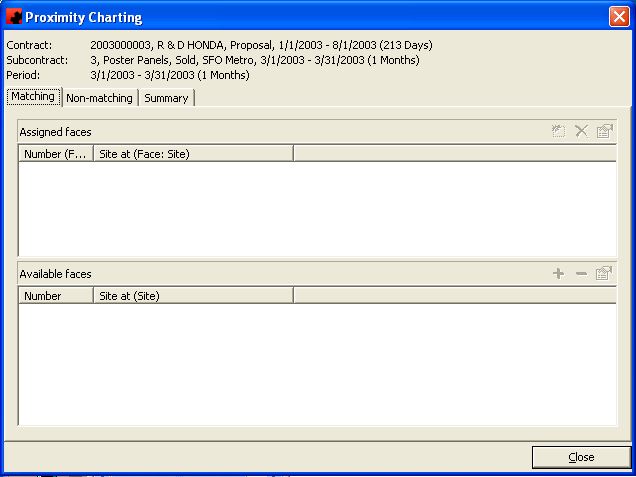
The following Proximity Charting screen will now open.
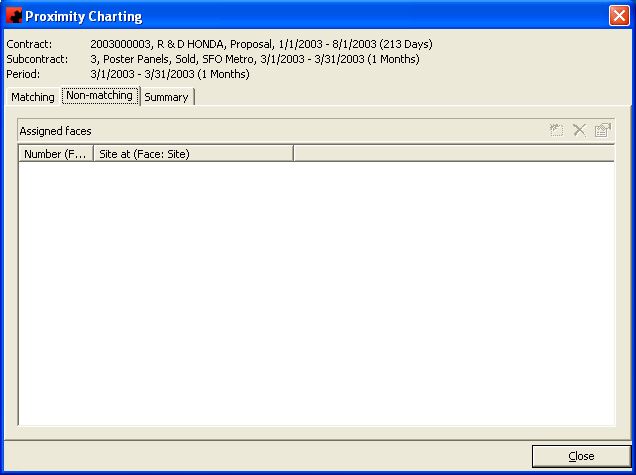
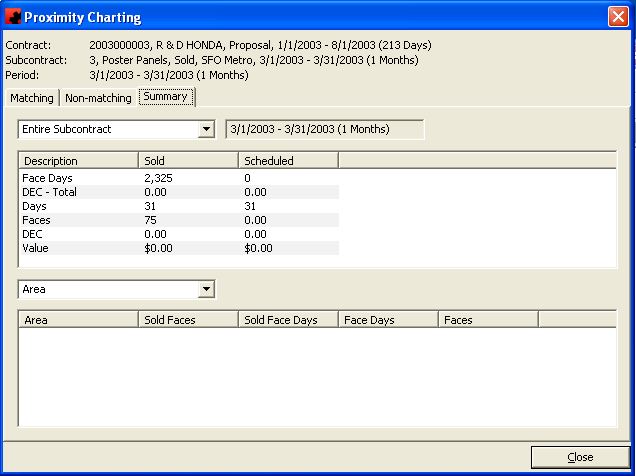
This screen has three tabs, the Matching Tab, the Non-matching Tab, and the Summary Tab. The Matching Tab shows you the Subcontract's currently assigned Faces that match the desired criteria, and the Available Faces that match your criteria.
The Non-matching Tab shows you all of this Subcontract's currently charted Faces that do not match the proximity criteria chosen.
The Summary Tab summarizes the Sold versus Scheduled faces assigned to the Subcontract.
To chart your Subcontract only using the proximity criteria selected, go to the Non-matching Tab and highlight all the faces listed there. Click on the Delete button to release them from your Subcontract. Next, go to the Matching Tab and highight the Faces in the Available Locations list that you wish to add to your Subcontract. Click on the Assign face(s) to the Subcontract
button, and the new faces are assigned to the Subcontract. Ad Manager will check for potential conflicts before it assigns the new Faces to the Subcontract. Always check the Summary Tab before closing to ensure you have met your showing requirements.
Once you have charted all the Faces you need, click on the Close button. Your map will now show the updated charting of the Subcontract with all your Face symbols within or outside the proximity area, as chosen in your criteria. You may now close the Available Faces layer on your map, if you wish to print it. See Printing a Map.
Viewing Contracts on the Map
Mapping a Contract means spotting the map with all the Faces that have been assigned to that Contract for part or all of its duration. For instance, if you have a Contract that comprises one Subcontract, then mapping the Contract and mapping the Subcontract is one and the same thing. However, if you have a complex Contract that comprises several Subcontracts, each representing a selection of Faces of possibly differing media types or covering different date ranges, then mapping the Contract will represent all these charted Faces together in order to provide a visual representation of the total impact of the Contract. This would be particularly useful in the case of a rotary Contract. By contrast, mapping each of the Subcontracts will enable you to focus on each part of the total showing separately.
When you map a Contract, all the subcontracted Faces will be represented on a single map layer, using the same symbol. You may prefer to add each Subcontract as a separate layer, which would allow you to choose a different symbol for each Subcontract or media or market.
Mapping Contracts
Mapping Subcontracts
Mapping a Contract
Open the Map Tool by clicking or going to the Tools menu and selecting Map.
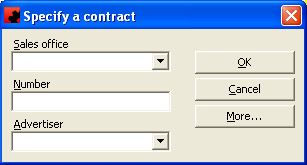
While in the Map Tool, select File - Open - Contract and the following dialog box will be displayed:
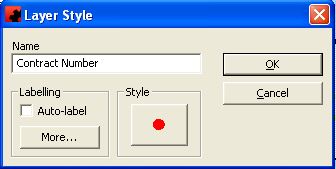
You can use the Number field to "quick find" the Contract, or narrow the search by Sales Office or Advertiser. You can also click on the More... button for additional filtering criteria. After selecting the Contract another dialog box will appear, Layer Style, prompting you to specify how you want to display the contracted locations.
The Name field enables you to create a name for the map layer that is different from the Contract number (This is the default). You can also specify the symbol and label style for this map layer. You can change these styles later, but not the name of the map layer.
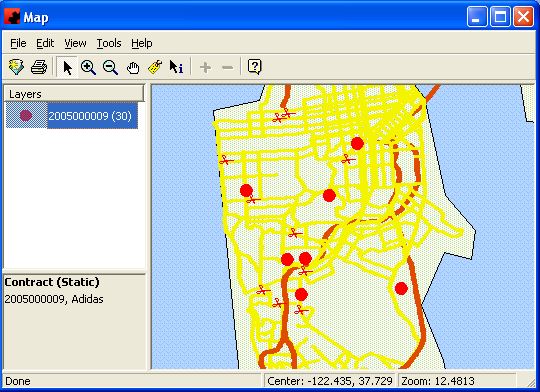
Once you have made the necessary selections on the Layer Style dialog box, select the button, and your Contract will be mapped.
It is also possible to view the Contract - Detail screen from the Map Tool by highlighting the layer name and selecting Properties from the File Menu.
You can also map Contracts using the drag and drop method of mapping from a filter. For information on how to map by this method, see Drag and Drop Contracts on a Map.
Mapping a Subcontract
Mapping a Subcontract is similar to mapping a Contract in that the resulting map will represent a set of contracted Faces, but if the Contract comprises more than one Subcontract, there is the advantage that you can display each set of the contracted Faces separately, possibly using different symbols. You can also name each layer differently (which could match, for instance, a brand name, a media type or a market).
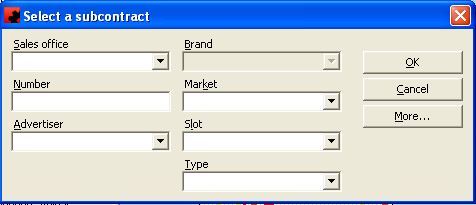
To map a Subcontract you must be in the Map Tool. Select File - Open - Subcontract and the following dialog box will be displayed:
You can "quick find" the Subcontract using basic information or click on the More... button for additional filtering criteria. After you select the Subcontract you will get another dialog box asking how to display the Subcontract.
The Name field enables you to create a name for the map layer that is different from the brand name (This is the default). You can also specify the symbol and label style for this map layer. You can change these styles later, but not the name of the map layer.
Once you have made the necessary selections on the Layer Style dialog box, select the button, and your Subcontract will be mapped.
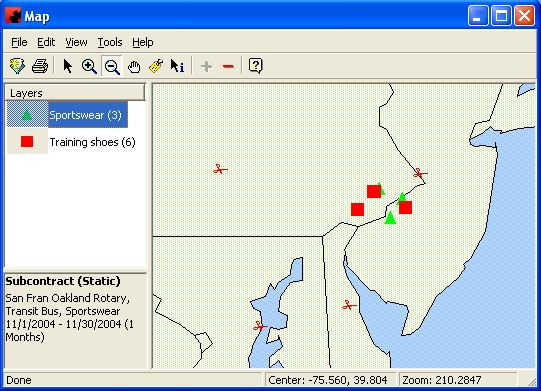
The example below shows two Subcontracts of a Contract, mapped as separate layers and using different symbols and colors.
Note: It is good practice to consistently use specific symbol styles and colors for specific media types.
It is also possible to view the Subcontract - Detail screen from the Map Tool by highlighting the layer name and selecting Properties from the File Menu.
You can also map Subcontracts using the drag and drop method of mapping from a filter. For information on how to map by this method, see Drag and Drop Subcontracts on a Map.
Viewing DemoTrack Demographics
Type topic text here.
Viewing Face Characteristics on a Map
To view the characteristics of a Face on the map, select the button on the top of the Map Tool window. Then click on the Face symbol you wish to view the properties of and the Face properties dialog box for the chosen Face will open.
Viewing Locations on the Map
There are two ways of viewing your Faces on a map, either by using the MAP TOOL or by going to the Map page on an individual site.
Viewing Locations Using The Map Tool
The MAP TOOL allows you to view any number of locations at once by spotting the map by displaying a previously saved query as the means of selecting Faces. For instance, if you regularly need to see where all your bus shelters are located, you might save this query on the Ad Manager explorer window as a public or personal filter. Or you might have a special folder containing queries that will search for available Faces in given time periods. Remember that a filter saved in this way is dynamic, meaning that the results of displaying it on the map may vary depending on inventory conditions.
For information on how to save the filter for future use, see How to Filter.
To open the Map Tool, click or go to the Tools menu and select Map.
To execute a previously saved query and use its results to spot the map select
and select the filter you wish to use.
When you have selected the filter and clicked on OK, you will be given an opportunity to give the map layer you are creating a name that is different from the filter name. This next dialog box also enables you to determine the symbol and label styles for this map layer. You can also change these attributes of the map layer later on, but you WILL NOT be able to change the layer name.
If you do not have a previously saved Face filter to select, then you can create a query in the Map Tool to create the map layer for the Faces that you want to see on the map. In effect, you will be using the FINDER to filter for the Faces, but you will not be able to save the query until you close the Map tool.
To execute a new query, select
When the FINDER is displayed, specify the criteria that will locate the Faces you want to map.
Once you have created a map layer based on this Finder criteria, you may discover that the results are not quite what you wanted. To modify the criteria used in the search and re-run the query to produce different results on the map, select
The Finder options will then display, allowing you to modify the search criteria for the existing map layer. Upon closing the Map Tool, you will have the opportunity to save any Face filters you have mapped.
You can also map Faces using the drag and drop method of mapping from a filter. For information on how to map by this method, see Drag and Drop Faces on a Map.
Viewing A Single Location using the Site Map Page
To view a single location, open the desired location's Site-details window and go to the MAP page.
For more information about the Site Map page, see Map.
